Enjoy this example of a Broward County Real Estate Market Report. You can also do a home search and save your favorite properties. Set up a search and be alerted as soon as a matching property hits our database. It’s Exclusive.
What is the Average Price Range in Broward County?
Including only Single Family Homes, October 2018 ended with a Broward County Average Price Range of $349,843. We are using the average here instead of the median where the highest price and lowest price homes are removed. Compare the average prices month-over-month for this year.
Here’s a look at the Broward County Real Estate Market for Current Month 2018. According to a report released on Current Month 6th by the Real Estate Experts, home prices continue to rise while inventory numbers shrink as we head into the next season.
From This Month of 2017 to This Month of 2018, the median sale price for homes in Broward County increased by 15.7 percent.
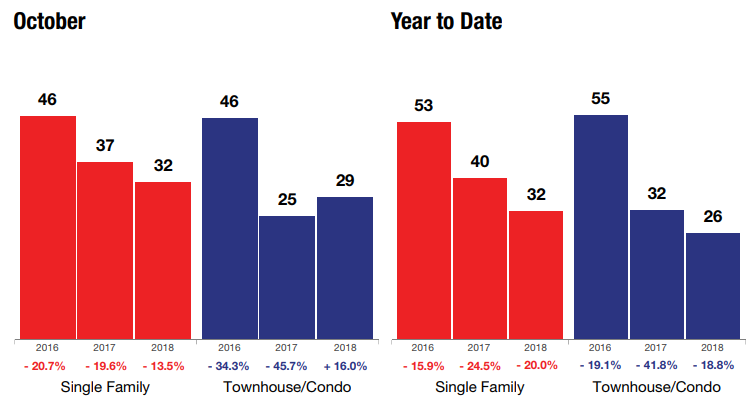
Last Month ended with a total of 3,886 condos, townhomes, and single-family homes sold. That is an impressive increase from the 2,704 sold in Previous Month, but the number is down 1.3 percent from last year at this time. The median price range of houses that sold in This Location during the month of Last Month was $245,000. This amount shows an increase of 15.7 percent from Last Month 2017 and an increase from the $227,000 of last month. READ MORE HERE
Others Have Asked
If you are thinking of selling and wonder how much your house might sell for in today’s Broward County Real Estate Market, use this instant home value estimate or call 702.917.0755. We serve Broward County and have partners across the nation as well.
Note: Additional content and headings may be applied to this page based on data provided to our team for your market reports.
Share This:
We use cookies to ensure that we give you the best experience on our website. If you continue to use this site we will assume that you are ok with this.